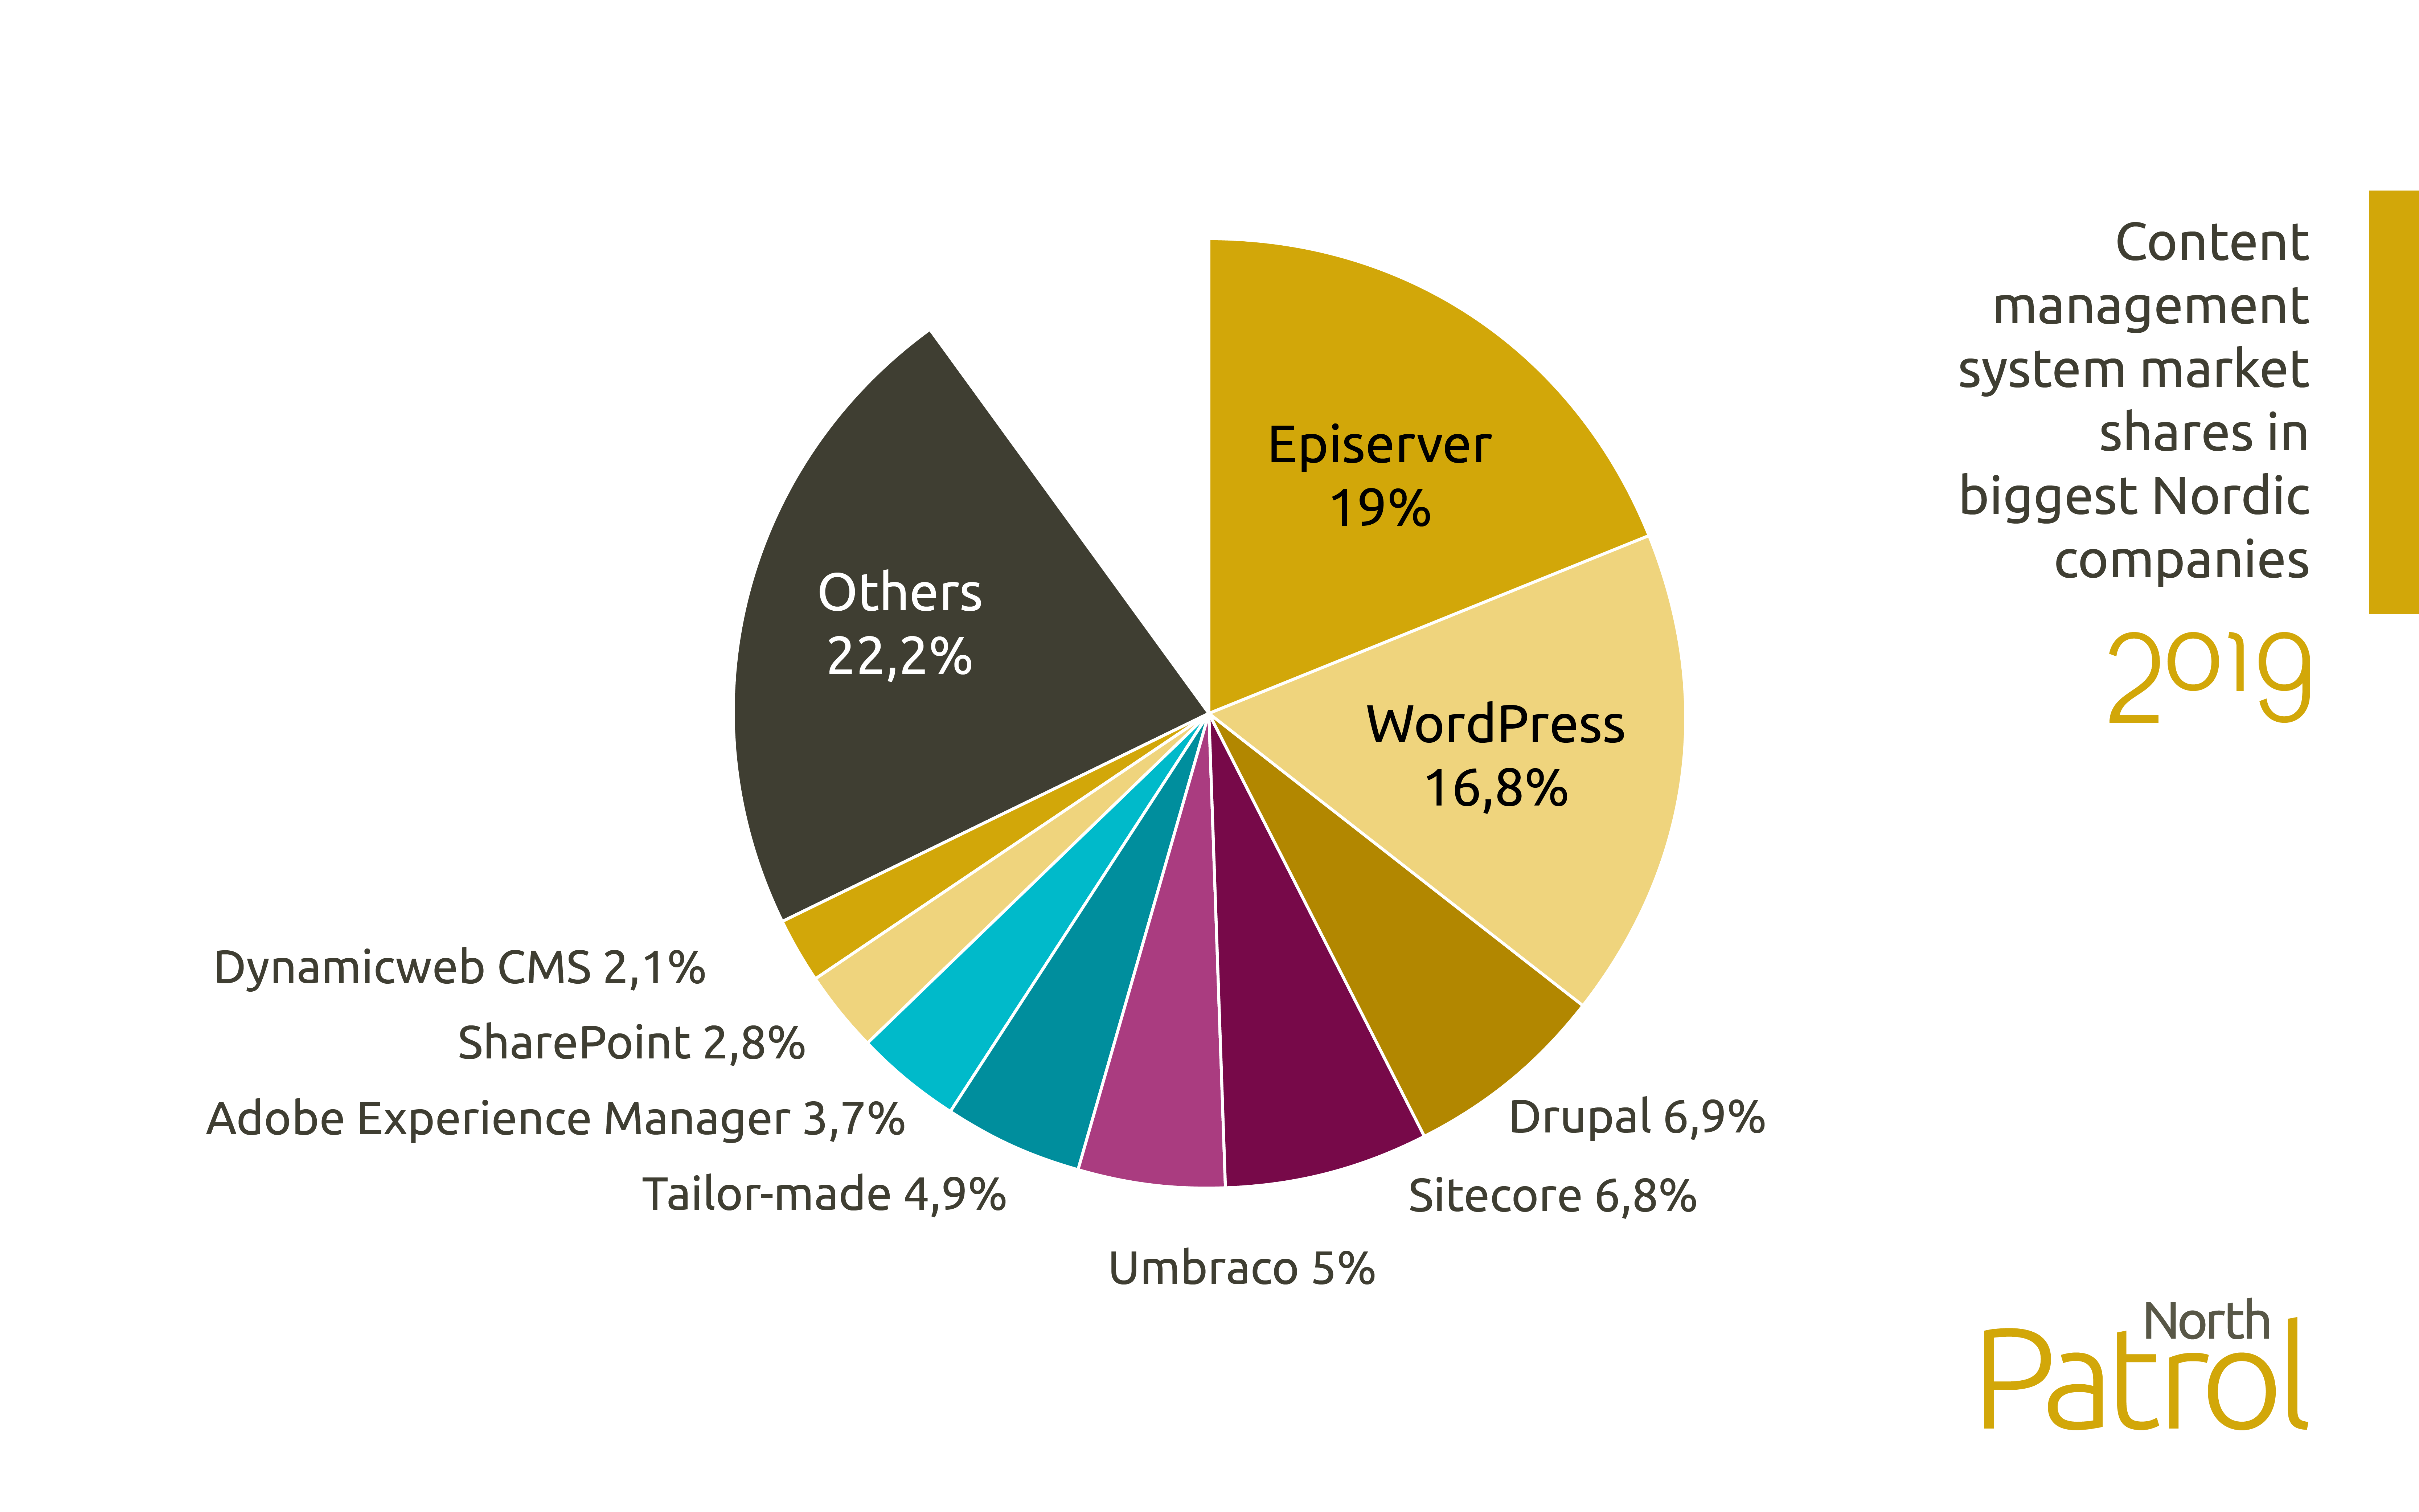
The Nordic championship in the heavyweight company series is a game of two. Episerver wins by 19 percent market share. The second place belongs to WordPress with about 17 percent. Drupal, taking the third place, must settle for 7 percent share. Just behind the last medal position follows tightly Sitecore just 0.1 percent behind Drupal, Umbraco with 5 percent share and tailor-made solutions with almost 5 percent share.
North Patrol is a consulting firm specialized in the design of digital services and information systems. We shape ideas into a vision and service concept, find the best architectural and technological solutions, design a functional user experience, and compete to find the ideal partner for implementation work. We do not sell implementation projects, nor do we sell licenses; we are genuinely on the side of the customer.
We examined the content management systems used by the biggest companies in Nordic countries. We selected the official web pages of the biggest companies in Finland, Sweden, Norway and Denmark in this review. We picked the 500 biggest companies by turnover, so altogether 2000 companies. For comparison we also focused on content management systems used by the 100 biggest Nordic companies.
Finland
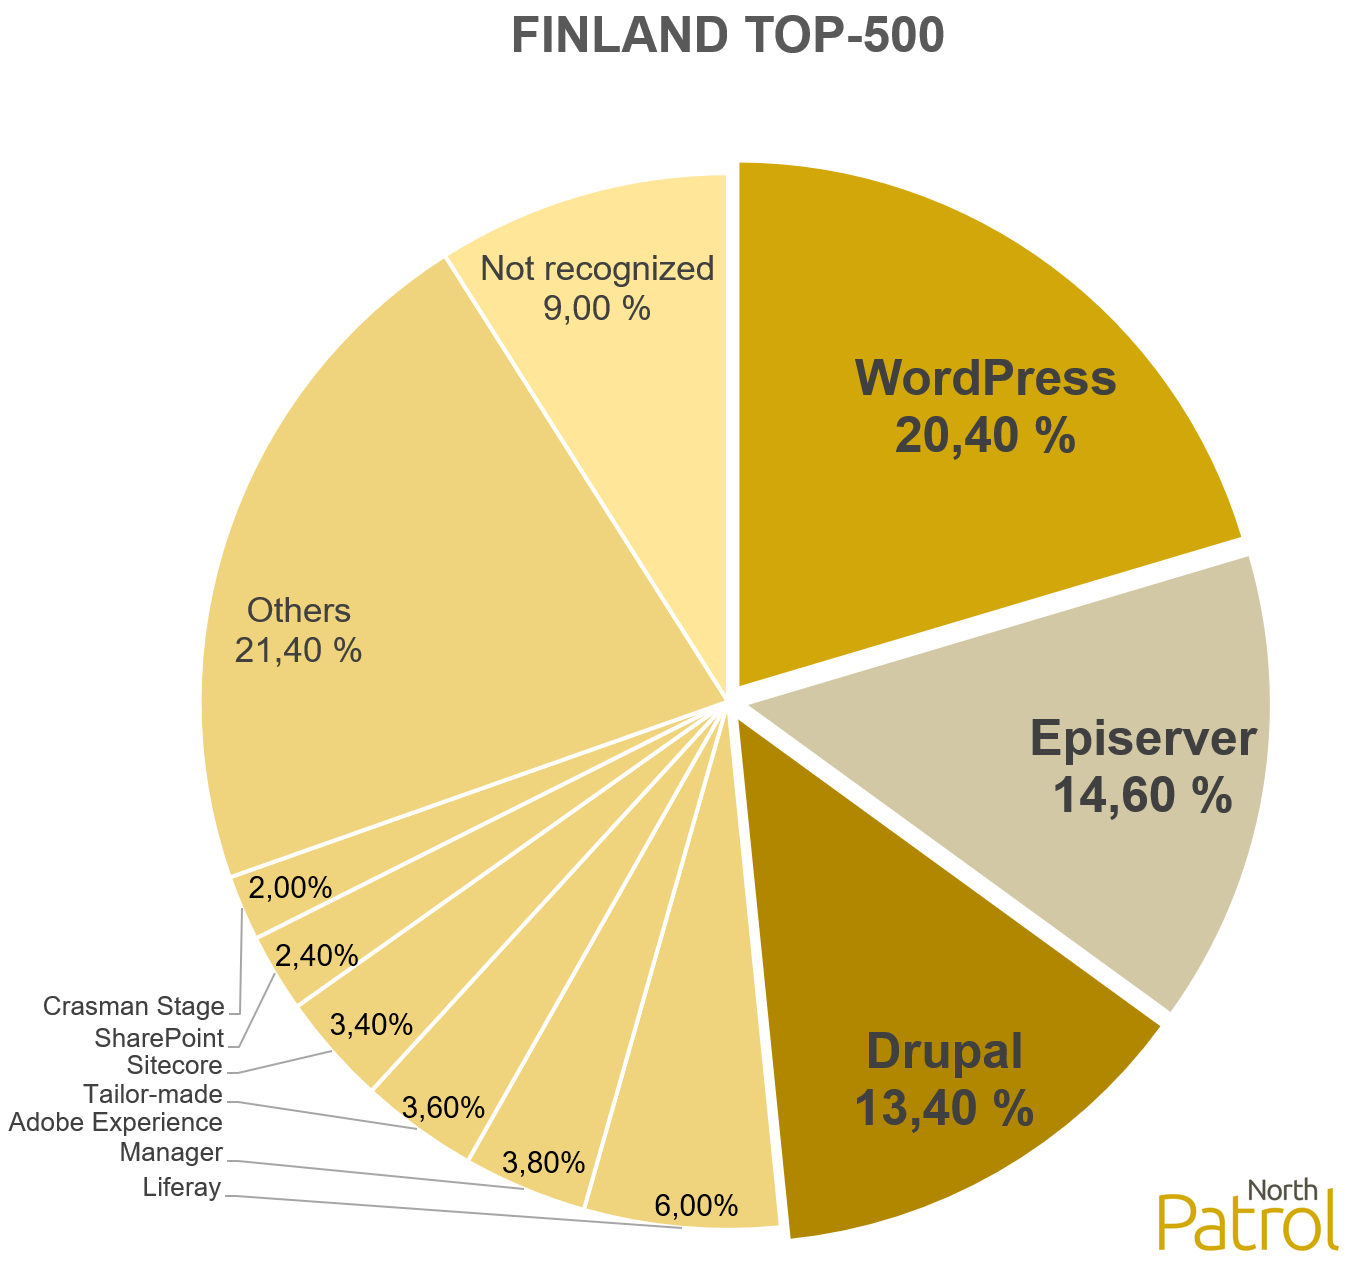
WordPress is a clear market leader in Finland with 20.4 percent market share. Episerver takes second place with 14.6 percent share as Drupal is chasing it with 13.4 percent share. Drupal has a special status in Finland, because it does not make its way to the podiums in any other country. Also, Liferay in the fourth place is an oddity, because it does not get to the top chart in any other country at all.
Examples of Finnish top-3:
WordPress: Amer Sports Oyj, Sanoma Oyj, Kamux Oyj
Episerver: Orion Oyj, Veho Oy Ab, Terveystalo Oyj
Drupal: Konecranes Oyj, Martela Oyj, Paulig Ab
Sweden
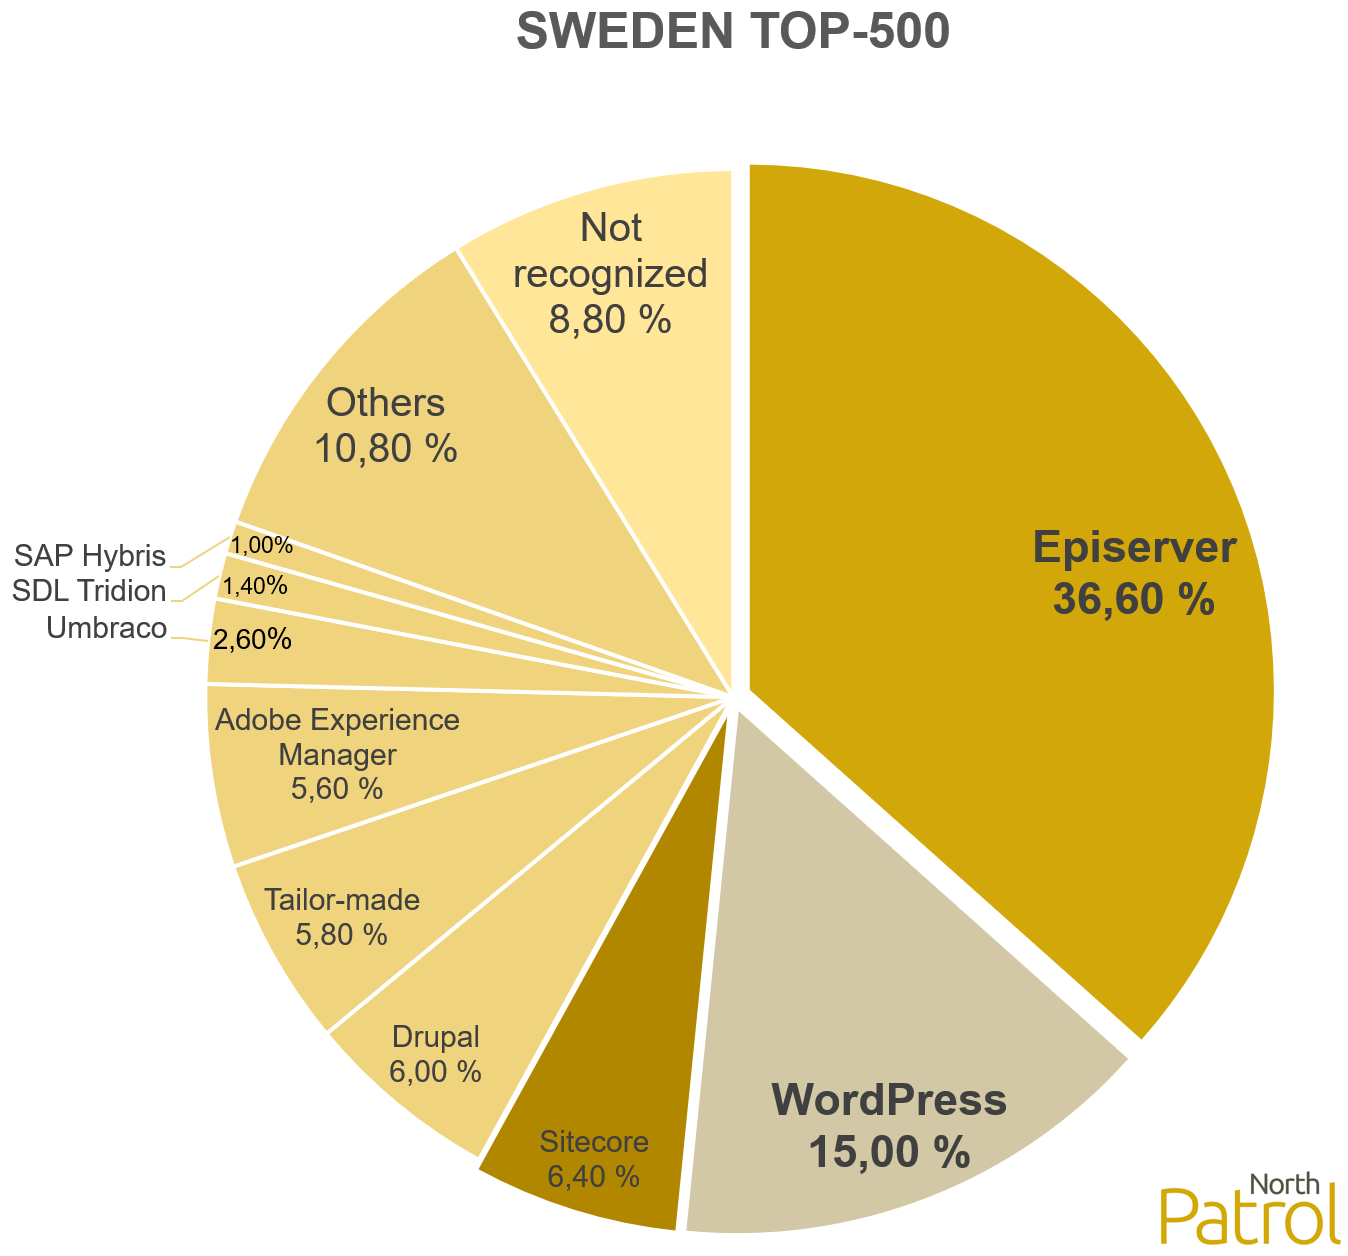
In its domestic markets, Episerver is hoarding 36.6 percent market share. WordPress is also strong, with a 15 percent market share. When compared to them, Sitecore in third position almost belongs already into the bantam series with its 6.4 percent market share. Episerver and WordPress together are taking half of the markets. This is pressing the Others-series smaller in Sweden than in other Nordic countries. It also affects to the number of recognized content management systems in Sweden. In other countries the number is about 60, whereas in Sweden it is 40.
Examples of Swedish top-3:
Episerver: Ericsson, Telefon AB LM, Skanska AB, Vattenfall AB
WordPress: SAS AB, Mekonomen AB, Bilia Group AB
Sitecore: SSAB AB, Husqvarna AB, Hexagon AB
Norway
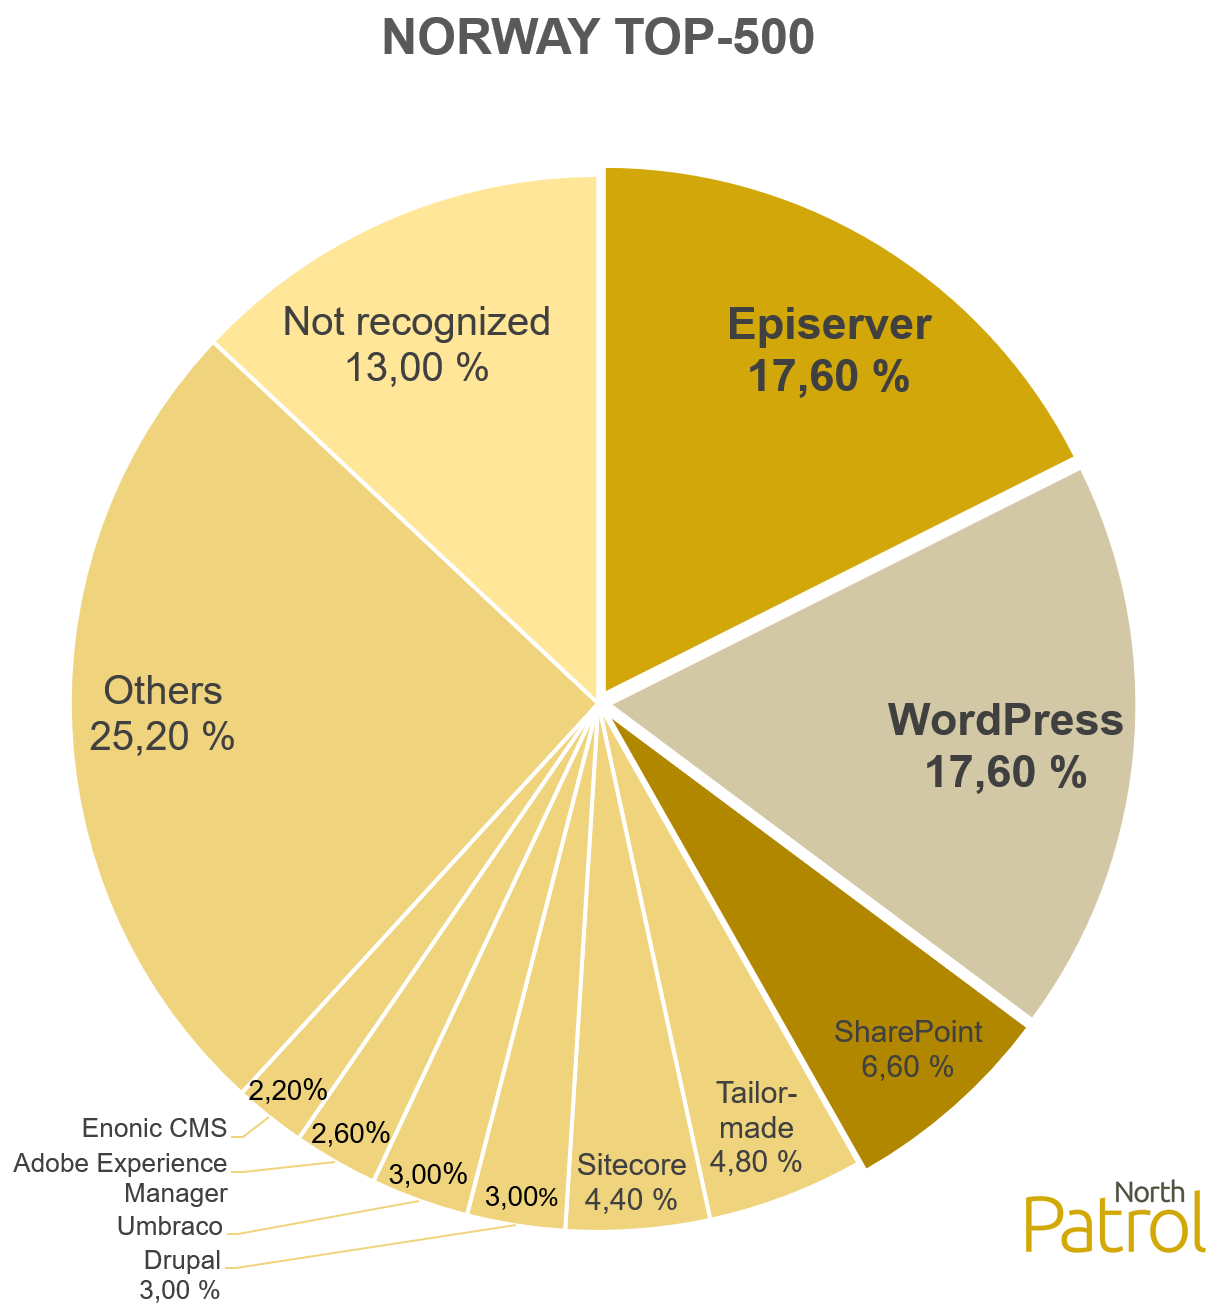
Norway has two gold medalists side-by-side: Episerver and WordPress. They both take 17.6 percent market share. A big surprise is SharePoint in third place. The vast majority of SharePoint users in Norway are hospitals. SharePoint gets to the top chart only in Finland. There are many exotic domestic content management systems from small vendors in Norway. Therefore, Others and Not recognized classes combined get 38.2 percent.
Examples of Norwegian top-3:
WordPress: XXL ASA, Relacom AS, SalMar ASA
Episerver: Yara International ASA, Coop Norge SA, Statkraft AS
SharePoint: Oslo Universitetssykehus HF, Helse Bergen HF, Vard Group AS
Denmark
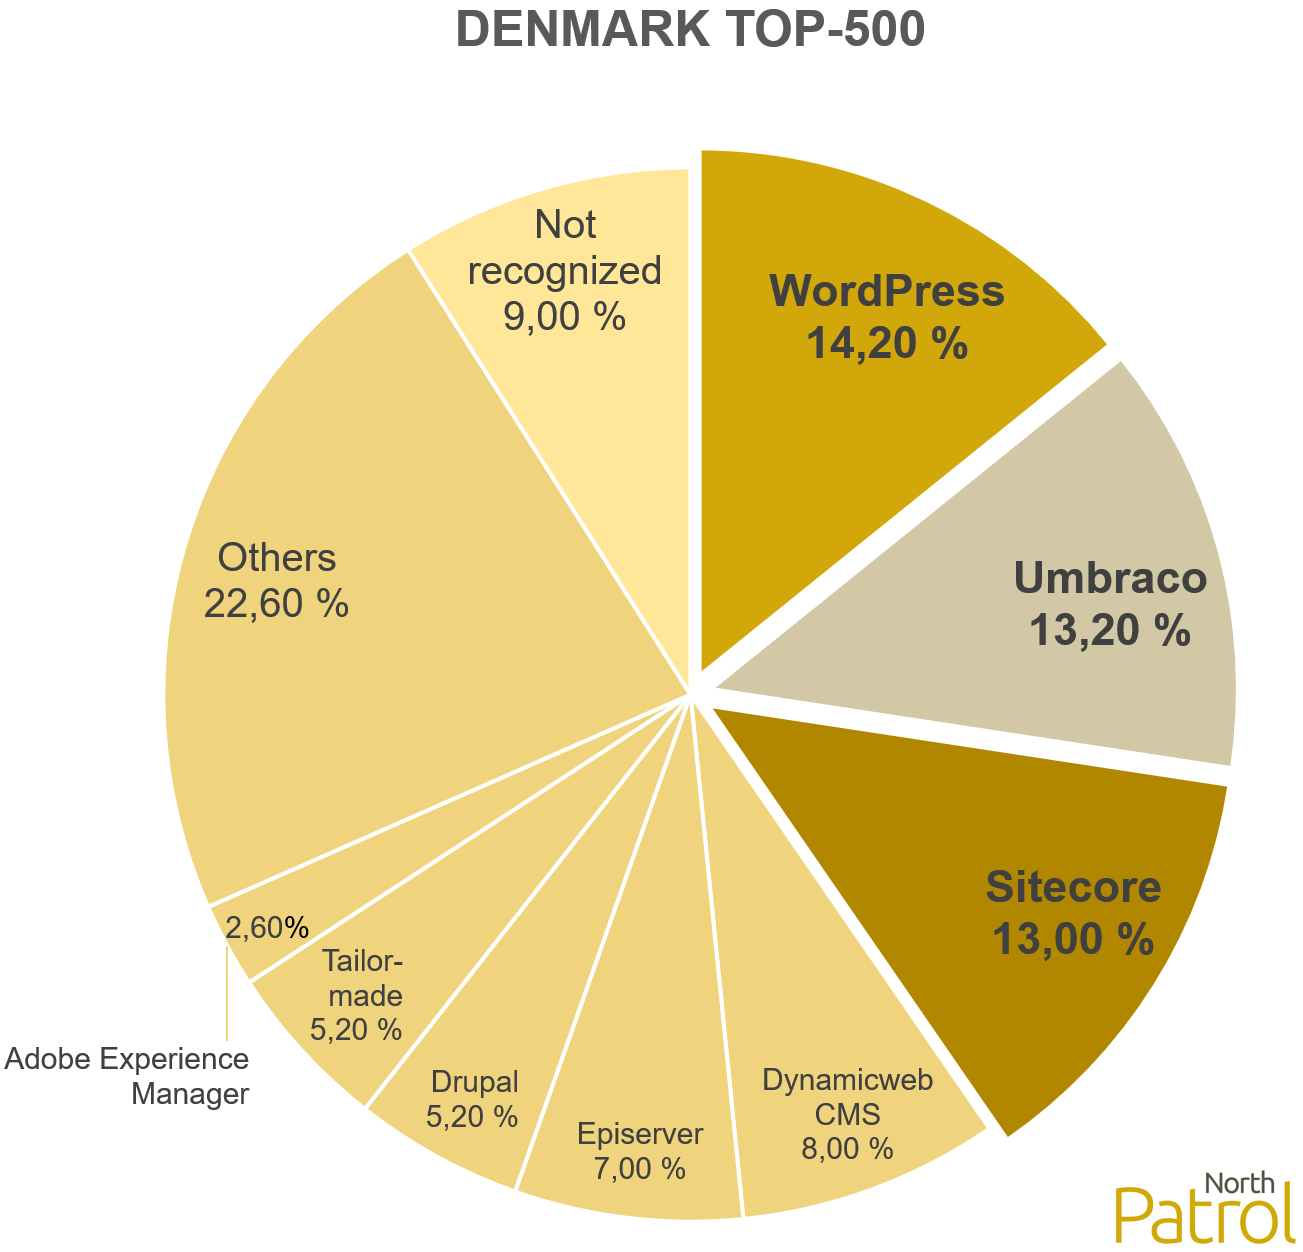
In Denmark the differences between content management system market shares are moderate. WordPress wins with only 14.2 percent market share. In all the other countries 14.2 percent would be in third place. The second place goes by a small margin to Umbraco with 13.2 percent share. Sitecore is following it closely with 13.0 percent share. In Denmark, as in Sweden and Norway domestic players are strong. Umbraco takes silver and Sitecore is right behind on bronze and Dynamicweb CMS takes the fourth place. They take altogether 34.2 percent market share.
Examples of Danish top-3:
WordPress: Dagrofa Logistik A/S, Skandinavisk Motor Co. A/S, Orkla Foods Danmark A/S
Episerver: DSB Vedligehold A/S, Bygma A/S, Alfa Laval Aalborg A/S
Drupal: Jysk A/S, Billetkontoret A/S, Akzo Nobel Salt A/S
How company size affects to the content management system choice
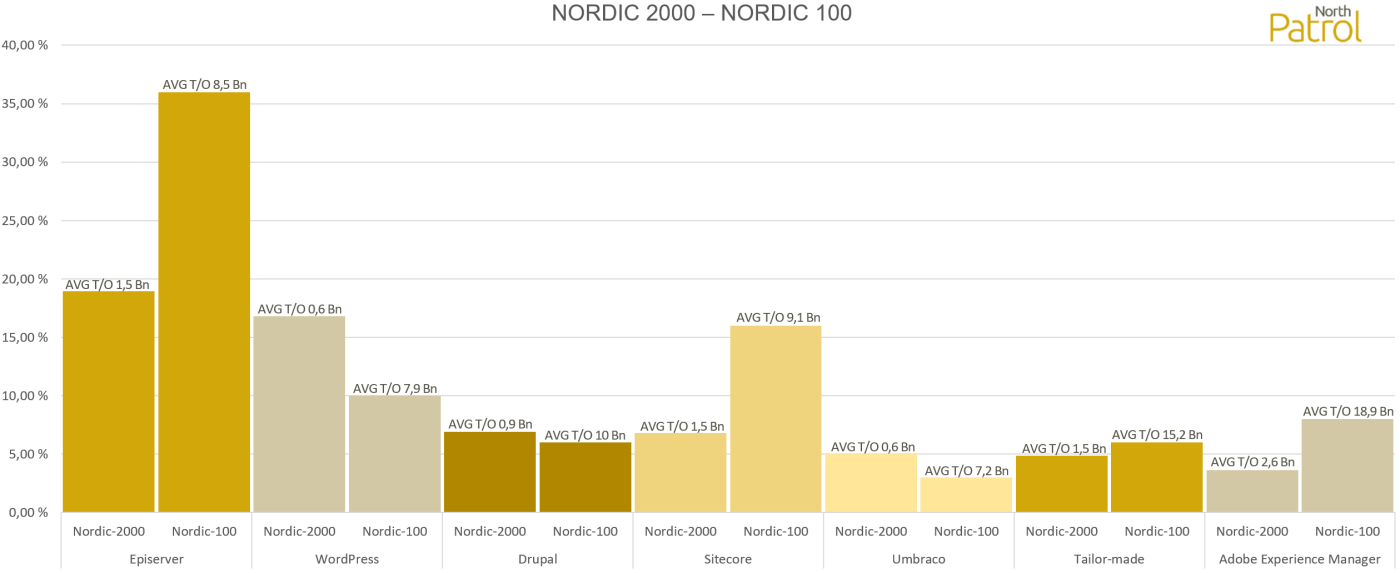
We filtered the data and looked at the market shares within the 100 biggest Nordic companies. Above is a chart that compares the market shares of the most common content management systems between all the 2000 Nordic companies and the 100 biggest of them.
Episerver almost doubles its share from 18.95 percent to 36 percent, when focusing on the Top-100 Nordic companies. We made a similar review earlier about Finnish Top-1000 companies. It showed that this is not surprising, because the change with Episerver in Finland was very similar to the change in Nordic countries. The popularity of WordPress drops with the growth of the company sizes from 16.8 percent down to 10 percent. Its popularity is still very high even in the Top-100, although the smallest revenue in this class is almost 4 billion euros. Sitecore does the biggest leap. Its market share rises from 6.8 percent in the whole data to 16 percent in the Top-100. Also, Adobe Experience Manager rises significantly from 3.65 percent to 8 percent. It is used nearly exclusively by the biggest of the biggest companies.
| TOP2000 | TOP100 | FINLAND | SWEDEN | NORWAY | DENMARK | |
|---|---|---|---|---|---|---|
| Episerver | 18.95% | 36.00% | 14.60% | 36.60% | 17.60% | 7.00% |
| 1.5 Bn | 8.5 Bn | 1.3 Bn | 1.9 Bn | 1.2 Bn | 0.6 Bn | |
| WordPress | 16.80% | 10.00% | 20.40% | 15.00% | 17.60% | 14.20% |
| 0.6 Bn | 7.9 Bn | 0.3 Bn | 1.4 Bn | 0.7 Bn | 0.2 Bn | |
| Drupal | 6.90% | 6.00% | 13.40% | 6.00% | 3.00% | 5.20% |
| 0.9 Bn | 10.0 Bn | 1.1 Bn | 1.0 Bn | 0.7 Bn | 0.2 Bn | |
| Sitecore | 6.80% | 16.00% | 3.40% | 6.40% | 4.40% | 13.00% |
| 1.5 Bn | 9.1 Bn | 1.7 Bn | 1.4 Bn | 0.6 Bn | 1.8 Bn | |
| Umbraco | 5.00% | 3.00% | 1.20% | 2.60% | 3.00% | 13.20% |
| 0.6 Bn | 7.2 Bn | 0.2 Bn | 0.9 Bn | 0.6 Bn | 0.6 Bn | |
| Räätälöity | 4.85% | 6.00% | 3.60% | 5.80% | 4.80% | 5.20% |
| 1.5 Bn | 15.2 Bn | 0.6 Bn | 3.6 Bn | 0.8 Bn | 0.2 Bn | |
| Adobe Experience Manager | 3.65% | 8.00% | 3.80% | 5.60% | 2.60% | 2.60% |
| 2.6 Bn | 18.9 Bn | 0.2 Bn | 3.7 Bn | 5.0 Bn | 1.6 Bn | |
| SharePoint | 2.80% | 2.00% | 2.40% | 0.60% | 6.60% | 1.60% |
| 0.8 Bn | 6.9 Bn | 1.0 Bn | 0.6 Bn | 1.0 Bn | 0.1 Bn | |
| Dynamicweb CMS | 2.10% | – | – | – | 0.40% | 8.00% |
| 0.2 Bn | – | – | – | 0.7 Bn | 0.2 Bn | |
| Average areal turnover of all companies | 1.0 Bn | 9.6 Bn | 0.7 Bn | 1.7 Bn | 0.9 Bn | 0.5 Bn |
The table above represents the market share of each content management system from the chart of the Top-2000 and the average revenues per area for the companies using them. Companies using Adobe Experience Manager have the highest average revenue in Nordic countries. The only exception to this is Finland, where it is used mainly by branches of foreign companies. Companies using Episerver have high revenues in every country. It exceeds the average revenue of each country. It is interesting however, that Episerver does not reach the average revenue of all the companies in the Top-100 comparison. WordPress is very close to the revenue of companies with Drupal, even shoulder to shoulder in Norway, but lags significantly behind in Finland. In Nordic countries the companies using tailor-made solutions have about 1.5 times the revenue when compared to average revenues of the Top-2000 or the Top-100.
Conclusion
Episerver is the biggest content management system in the Nordic countries. WordPress is a strong challenger. The revenue of a company correlates to some extent with the content management system choice. In Finland, domestic players don’t play almost any role in the markets, whereas in other Nordic countries being a domestic is an advantage.